yEd Graph Editor
yEd Graph Editor from yWorks GmbH is a freely available graph editor written in Java that runs on Windows, macOS, and Linux/Unix. It is a powerful desktop application that can be used to quickly and effectively generate high-quality diagrams.
yEd uses the XML-based GraphML format to load/save diagrams and additionally supports import from Excel spreadsheets (.xls, .xlsx) and arbitrary XML (via XSLT). Creating diagrams manually is easy and fun with the intuitive user interface, and a large collection of powerful layout algorithms allows to automatically arrange nodes and edges. Diagrams can be exported to bitmap and vector formats: PNG, JPG, and SVG, PDF.
Since version 3.17.1 yEd provides a palette section for Systems Biology Graphical Notation.
There are some tips available on how to use yEd for drawing SBGN diagrams.
ySBGN
ySBGN is a standalone Java application, a bidirectional converter between GraphML format of the yEd Graph Editor and the SBGN Process Description or Activity Flow languages (Balaur et al. 2022, https://doi.org/10.1515/jib-2022-0030).
Now diagrams can be created in the intuitive general-purpose yEd Graph Editor using the SBGN Palette available since version 3.17.1, and, thanks to the converter, the outcome could be offered in the standard Systems Biology format. The ySBGN tool supports keeping annotation information in the SBGN-ML format.
For reporting issues please use ySBGN GitHub Issues page.
Newt Editor
Newt Editor is a free, web-based, open-source viewer and editor for pathways in Systems Biology Graphical Notation. It is written with a series of libraries and extensions based on Cytoscape.js.
Newt is developed to make it easy to design SBGN diagrams: rich yet minimalistic user-friendly IU; support for developing maps from scratch; automatic layout facilities; full support for complexes, compartments and submaps; state-of-the-art complexity management through hide-show and collapse-expand functionalities; advanced diagramming with grid and alignment support, resizing and styling map objects, and more.
SBGN-ED
SBGN-ED is an open-source SBGN editor which allows creating, editing and exploring diagrams in all three SBGN languages: Process Description, Activity Flow and Entity Relationship (Czauderna et al., 2010, doi:/10.1093/bioinformatics/btq407). It allows validation of the syntactical and semantical correctness of created or edited maps. Already existing non-SBGN maps from the KEGG database can be translated into SBGN PD maps including automatic layout. Translation of PD to AF maps and visualisation of SBML models in SBGN PD are also provided. Additionally, the tool allows exporting of SBGN maps into several file and image formats including the SBGN-ML format.
SBGN-ED is an add-on of the VANTED framework. VANTED is an integrative and extendable framework for systems biology applications which aims at the integration, analysis and visual exploration of experimental data in the context of biological networks as well as the modelling, simulation and analysis of molecular biological processes.
CellDesigner
CellDesigner is a diagram editor developed by the Systems Biology Institute for drawing process diagrams (Kitano et al., 2005, PMID 19668183) using the graphical notation proposed by Prof. Hiroaki Kitano, and stored in SBML format. CellDesigner supports the development of mathematical models and is integrated with SBML ODE Solver, SBML Simulation Core and Copasi. The entities on a diagram can be annotated and linked to various databases.
CellDesigner supports a system of symbols based on a draft of the Systems Biology Graphical Notation (SBGN) Process Description language Level 1 proposed in 2008 (more information can be found here). SBGN Viewer tool in CellDesigner can be used to see a diagram in the current version of SBGN (Le Novère et al., 2009, PMID 19668183).
Network-based approach for metabolic and signalling data integration
In Systems Biology, graph database approaches aim to facilitate integration, exploration and visualisation of information, which can be represented by graphs, with nodes and edges representing entities and relationships/connections among them, respectively (Lysenko et al. 2016). Previously, we developed the Recon2Neo4j framework (Balaur et al. 2016 PMID: 27993779) that offers a graph database representation to the human metabolic information (Thiele et. al. 2013) and aims to facilitate exploration of the integrated data. We extended the Recon2Neo4j framework to integrate information on the set of signalling processes and corresponding human pathways, extracted from the Neo4j graph database version of the Reactome Knowledgebase (http://www.reactome.org, accessed 20/03/2017) [Fabregat et al. 2018, PMID: 29377902; Fabregat et al. 2016, PMID: 26656494].
Signalling-metabolic data model
A signalling process was defined as a process where at least one reactant and at least one product are proteins or protein complexes (as shown in the brief SBGN representation):
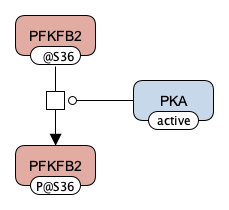
Figure caption: An illustration of a signalling process structure based on the Glycolysis map.
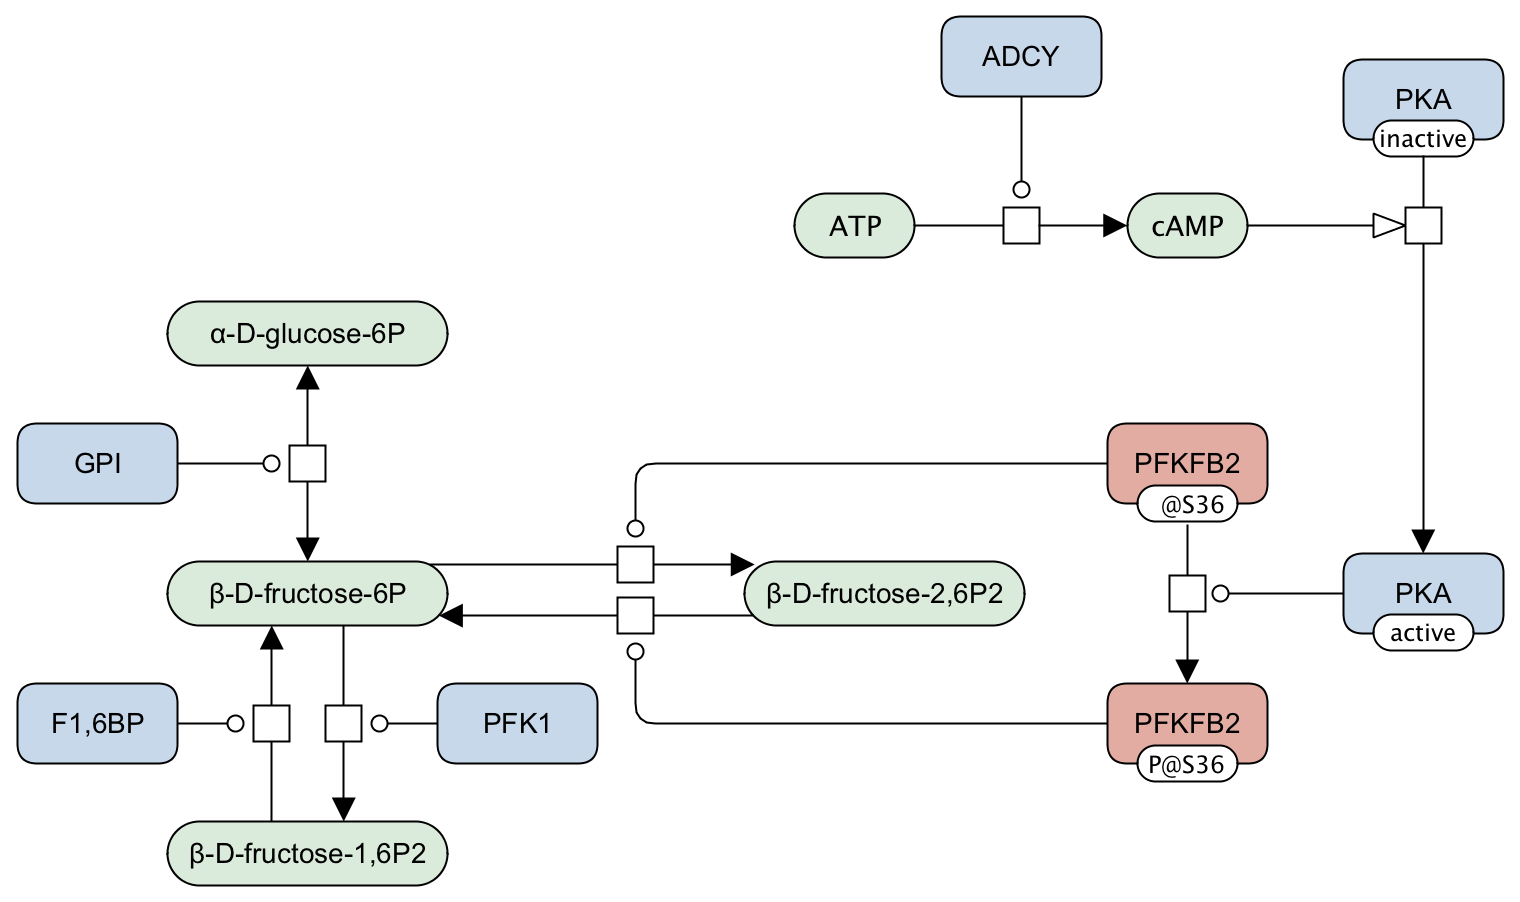
We used Cypher queries and we extracted information on the set of signalling processes using the Reactome Knowledgebase. Details on the Cypher query for the identification of the set of signalling processes using the Reactome Knowledgebase are available in the ReactomeCypherQueries file.
In Recon2Neo4j, a metabolic reaction is shown as a detailed subgraph with a node (given by the metabolic reaction name itself), connected by a set of edges (e.g. Consumption, Production, Catalysis) to nodes representing the involved biological entities, including the metabolites (reactants and products) and enzymes/catalyzers (proteins and complexes). In addition, the relationship between biological complexes and compound proteins (represented also as nodes) was represented by the “Part_Of” edge.
Every protein acting as an enzyme in metabolic reactions in the Recon2Neo4j framework was checked for its involvement in signalling processes. Once such an enzymatic protein - signalling process pair was found, the process information was added to the framework as a Process node only if the process name did not already exist in the graph, (in order to have unique nodes only). Process information including the Reactome name, identifier, url was stored as attributes of the Process node and the enzymatic protein - process involvement relationship was represented by the “In_Process” edge connecting the Protein and Process corresponding nodes. Similarly, the involvement of protein compounds of complexes in signalling processes was also represented by the “In_Process” edges, connecting the Protein Compound and Process nodes of the involved protein-component and biological complex. Moreover, the set of human pathways containing the signalling processes included in the framework was also integrated into the framework. Specifically, pathways were represented by the Pathway nodes, (with their Reactome name, identifier, and url as node attributes), and the relationships between the signalling processes and pathways were shown by the “In_Pathway” edges connecting the corresponding Process and Pathway nodes. The data model of the extended version of the Recon2Neo4j to include information on 1) protein - process, and 2) process - pathways involvement relationships is illustrated in the Data model figure below.
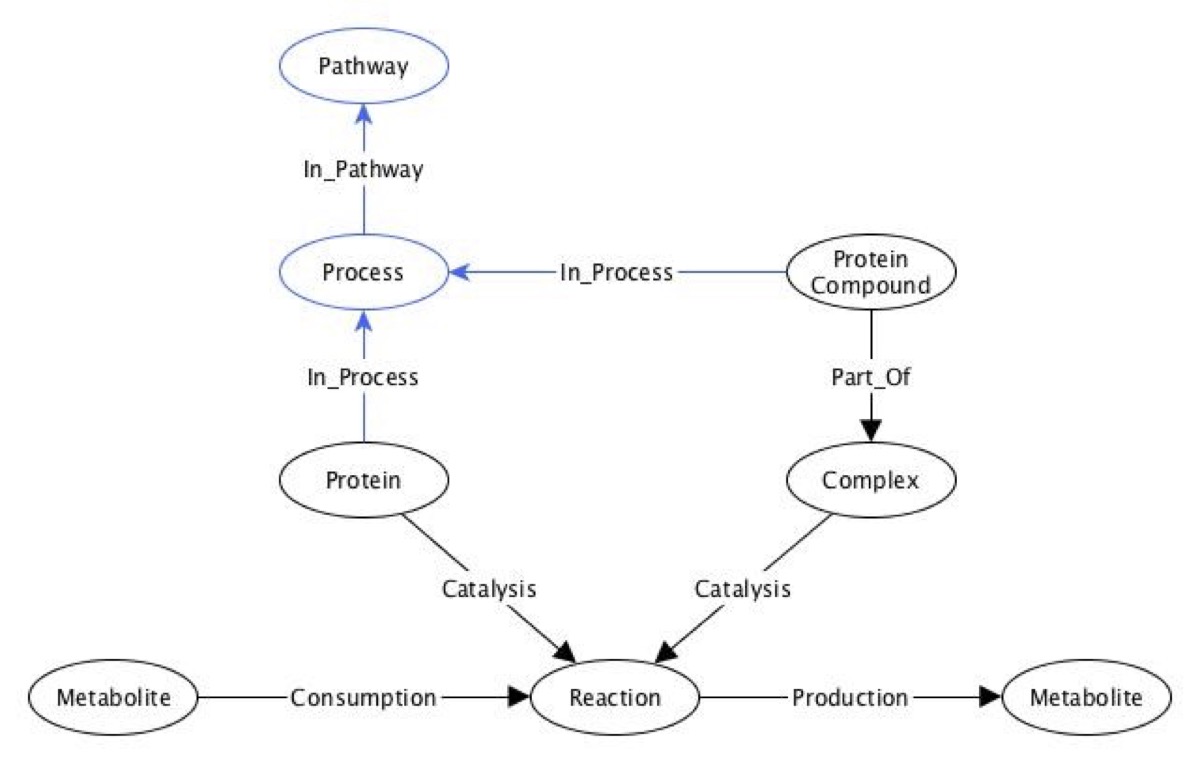
Figure caption: Data model of the extended version of the Recon2Neo4j framework to include signalling processes and pathway information (Fabregat 2016 PMID 26656494). Biological concepts such as metabolites, metabolic reactions, proteins, biological complexes, compound proteins, signalling processes and involving human pathways are represented by nodes, with relationships among these classes represented by edges. For example, the protein-signalling process involvement is shown by the “In Process” edge connecting the Protein and Process nodes (classes). Figure adapted from Balaur et al. (Balaur 2016 PMID: 27993779) with newly-added process and pathway information representation (the Process and Pathway nodes and the “In Process” and “In Pathway” relationships) shown in blue colour.